


Coloring by orbit traps is probably the most common method to make traditional fractal images more interesting. Even back in the Fractint era (1989) the so-called "epsilon cross" rendering mode was nothing else than an orbit trap. The idea behind it is really simple, but the amount of possibilities it provides to create structures and color patterns are infinite. Today, the orbit traps formulas are widely used in all sort of fractal image generation applications.
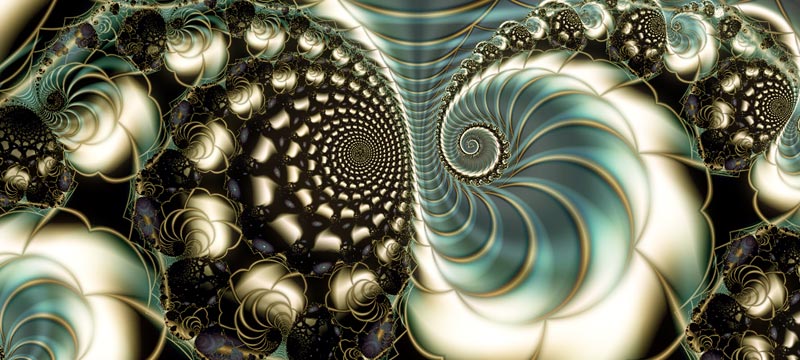
A combination of line and point orbit traps, done in 2000 - Click image to enlarge
Even though the technique can be easily extended to higher dimensions (like 3D orbit traps), we will stick to two dimensions for now. Therefore, we are working with complex numbers in a complex plane, either the C plane (parameter plane) for the Mandelbrot set of the Z plane (dynamic plane) for Julia sets. In the old escape method coloring technique the amount of iterations needed to escape a bailout radius is used as index into a color palette (procedural or LUT-based). What we want is to find an alternative way to assign a color index to that point or pixel.
For that, we are going to analyze all the sequence of points that was generated during the iteration process. That set of points is usually referred to as "the orbit". For the Mandelbrot set, the orbit would therefore be the sequence { 0, c, c2+c, c4+2c3+c2+c, ... }, and for a Julia set {z, z2+c, ... }, etc. Of course, any dynamical system that produces a series of points after repeated iteration is a candidate for this technique, it's not restricted to Mandelbrot or Julia sets. But let's continue assuming we are working with the Mandelbrot set.
So, given an orbit orbit(c) = { 0, c, c2+c, ... } we can decide to study how this orbit looks like when plotted in the plane. Since iterating the fractal is applying a well defined transformation to each point, a scale and rotation by 2 and a small offset c, we know that the orbit will be some sort of spiral. If the point c is inside the Mandelbrot set, then it will spiral inwards into a single point or a finite set of points in an oscillatory dynamic, depending in which bulb or component of the set the starting point was. If the point is ourside the set, it will spiral outwards towards infinity, and the closer c is to the set border, the longer this orbit will be and the longer it will joyfully move around the set until it eventually takes off forever. What we are seeking for is to analyze somehow this orbit and extract a different color for each.
It's up to us to define that somehow, but the simplest things is probably to look for which is the closest distance from any point in the orbit to the origin of the plane, or any other arbitrary (user defined) point in the plane. This is called "point trapping". Something like:
This produces some nice bubbles all over the plane, that follow the fractal structure of the image. For example, if there is an spiral somewhere in the image, the bubbles will concentrate on the sides of the spiral and follow it ad infinitum.
In this first example we were using the distance to a point |z-point| as trapping criteria, but we could decide to index the colors not based on this distance, but in the argument of the point in the orbit whose distance was the minimum to the user define point. We can also generalize the method by computing the closest distance not to a point, but to a line. Then, we are speaking of "line traps". Depending on the origin and orientation of the line, different patterns will emerge in the fractal image, although they always follow the fractal structure as in the case of point traps.
At this point nothing stops us from introducing even more geometric figures beyond points and lines and compute distances to then. Ellipses, rings, hyperbolas, rectangles, stars, etc. It's really up to our imagination. You can even use fractals or procedural functions as traps, or even use pictures as orbit traps. The posibilities are endless.
We can also distort these shapes with arbitrary mappings like sin deformations, cartesian-to-polar change of variables, etc.
Another interesting extension is to make the trap change as the orbit progresses, like the position of the point or the inclination of the line. The distortion parameters can also be changed during the iteration process. Possibilities are truly endless.
It's also possible to keep track of the relation of the orbit to more than one trap, and then combine the results to give a single color index. Possibilities can be the min or the max distance of all the traps.
It's also interesting sometimes to collect other more complex statistical values than the minimum distance. Average distance or the standard deviation of the distances from every point in the orbit result in pleasing images too.
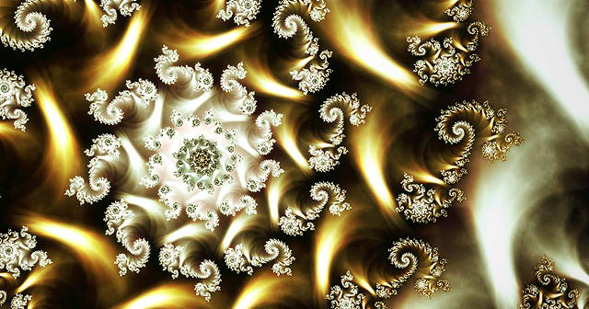
A combination of line orbit traps, done in 2001. Click image to enlarge
A combination of line orbit traps - done in 2001

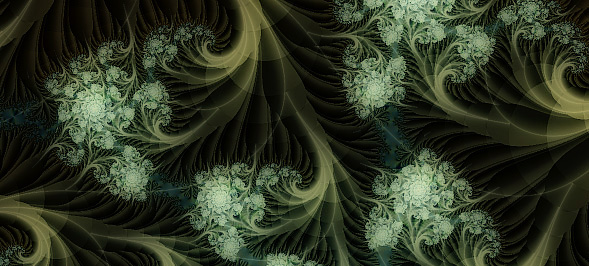
Line traps, done in 2001 - Click image to enlarge
With such a huge amount of possibilities to choose from it seems natural to extend the palette indexing method for coloring a pixel to a multilayer system. For example, we could compute some colors using a given certain orbit trap and palette settings, do the same thing with another orbit trap and palette, and then combine the color results. This can be done with as many of these "layers" as needed and with any blending mode we can think of, for every layer (see your favourite image processing program). This is pretty much what programs like Ultrafractal do, and it was the main technique used around the years 1998 to 2002.
Another example is the Julia Slide 4k intro I made in 2001.
A combination of line and point orbit traps, done in 2000 - Click image to enlarge
The idea
Even though the technique can be easily extended to higher dimensions (like 3D orbit traps), we will stick to two dimensions for now. Therefore, we are working with complex numbers in a complex plane, either the C plane (parameter plane) for the Mandelbrot set of the Z plane (dynamic plane) for Julia sets. In the old escape method coloring technique the amount of iterations needed to escape a bailout radius is used as index into a color palette (procedural or LUT-based). What we want is to find an alternative way to assign a color index to that point or pixel.
For that, we are going to analyze all the sequence of points that was generated during the iteration process. That set of points is usually referred to as "the orbit". For the Mandelbrot set, the orbit would therefore be the sequence { 0, c, c2+c, c4+2c3+c2+c, ... }, and for a Julia set {z, z2+c, ... }, etc. Of course, any dynamical system that produces a series of points after repeated iteration is a candidate for this technique, it's not restricted to Mandelbrot or Julia sets. But let's continue assuming we are working with the Mandelbrot set.
So, given an orbit orbit(c) = { 0, c, c2+c, ... } we can decide to study how this orbit looks like when plotted in the plane. Since iterating the fractal is applying a well defined transformation to each point, a scale and rotation by 2 and a small offset c, we know that the orbit will be some sort of spiral. If the point c is inside the Mandelbrot set, then it will spiral inwards into a single point or a finite set of points in an oscillatory dynamic, depending in which bulb or component of the set the starting point was. If the point is ourside the set, it will spiral outwards towards infinity, and the closer c is to the set border, the longer this orbit will be and the longer it will joyfully move around the set until it eventually takes off forever. What we are seeking for is to analyze somehow this orbit and extract a different color for each.
Trapping the orbit
It's up to us to define that somehow, but the simplest things is probably to look for which is the closest distance from any point in the orbit to the origin of the plane, or any other arbitrary (user defined) point in the plane. This is called "point trapping". Something like:
float iterate( complex c )
{
float dist = 1e20f;
Complex z = Complex( 0.0f );
for( int i=0; i<maxIterations; i++ )
{
z = z*z + c;
if( |z|>2.0f ) return 0.0f;
dist = min( dist, lengthSquared(z-point) );
}
return sqrtf( dist );
}
This produces some nice bubbles all over the plane, that follow the fractal structure of the image. For example, if there is an spiral somewhere in the image, the bubbles will concentrate on the sides of the spiral and follow it ad infinitum.
In this first example we were using the distance to a point |z-point| as trapping criteria, but we could decide to index the colors not based on this distance, but in the argument of the point in the orbit whose distance was the minimum to the user define point. We can also generalize the method by computing the closest distance not to a point, but to a line. Then, we are speaking of "line traps". Depending on the origin and orientation of the line, different patterns will emerge in the fractal image, although they always follow the fractal structure as in the case of point traps.
Extensions
At this point nothing stops us from introducing even more geometric figures beyond points and lines and compute distances to then. Ellipses, rings, hyperbolas, rectangles, stars, etc. It's really up to our imagination. You can even use fractals or procedural functions as traps, or even use pictures as orbit traps. The posibilities are endless.
We can also distort these shapes with arbitrary mappings like sin deformations, cartesian-to-polar change of variables, etc.
Another interesting extension is to make the trap change as the orbit progresses, like the position of the point or the inclination of the line. The distortion parameters can also be changed during the iteration process. Possibilities are truly endless.
It's also possible to keep track of the relation of the orbit to more than one trap, and then combine the results to give a single color index. Possibilities can be the min or the max distance of all the traps.
It's also interesting sometimes to collect other more complex statistical values than the minimum distance. Average distance or the standard deviation of the distances from every point in the orbit result in pleasing images too.
A combination of line orbit traps, done in 2001. Click image to enlarge
A combination of line orbit traps - done in 2001
Line traps, done in 2001 - Click image to enlarge
Layering
With such a huge amount of possibilities to choose from it seems natural to extend the palette indexing method for coloring a pixel to a multilayer system. For example, we could compute some colors using a given certain orbit trap and palette settings, do the same thing with another orbit trap and palette, and then combine the color results. This can be done with as many of these "layers" as needed and with any blending mode we can think of, for every layer (see your favourite image processing program). This is pretty much what programs like Ultrafractal do, and it was the main technique used around the years 1998 to 2002.
Another example is the Julia Slide 4k intro I made in 2001.